The Challenge: Proving an Ad Actually Worked
CTV doesn't give you a click to follow. Nobody can trace a living-room ad to a sale two weeks later — there's no cookie, no pixel, no trail.
So most advertisers end up trusting one of two things: the ad platform's own numbers (which it has every reason to make look good), or a single "lift" number that doesn't say whether it's real or just noise.
Either way, the question that actually matters never gets answered: did the campaign cause the sale — or would it have happened anyway?
The Solution: How Adrsta Gets a Real Answer
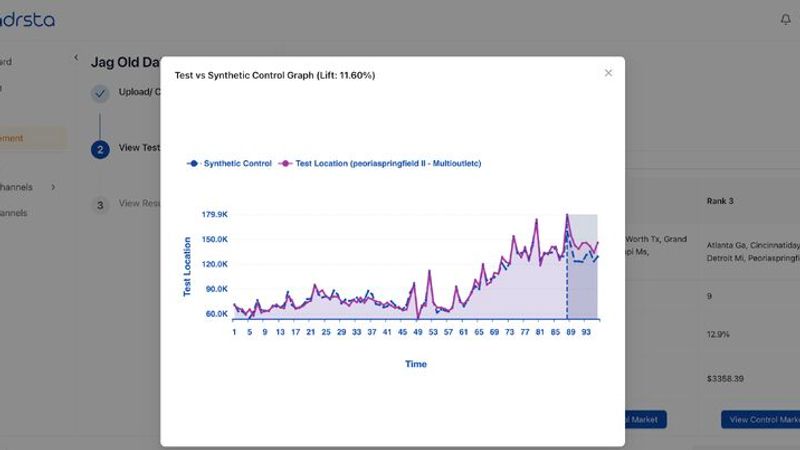
Adrsta answers that question with geo lift: it compares the market where a campaign ran to a synthetic "twin" built from markets where it didn't. The gap between the two — what really happened vs. what would have happened anyway — is the real, honest effect of the campaign.
The Adrsta Advantage: most measurement approaches ask you to spend a lot more — sometimes double your budget — just to get a trustworthy read. Adrsta doesn't need that. By carefully choosing which markets to test, we can detect a real effect at a much lower spend, so you get a confident answer without a massive budget spike.
Every study also comes with a confidence score, so you know exactly how much to trust the result, and a power analysis before the test even launches, so you're not spending money on a test that was never going to give you a real answer.
The Studies: Four Advertisers, Real Results
Four advertisers, eight studies — BAU spend, CTV spend, confidence bar, and lift, side by side.

Every one of these looks like a win at a glance. But a lift number only means as much as the bar it had to clear. Here's the full story behind each one.
Tax Filing Software Company — when the KPI you can measure isn't the one that pays the bills
BAU vs. CTV spend: Over the 21-day flight, Tax Filing Software Company spent $335,417 on business-as-usual (BAU) media. CTV added $48,827 on top — roughly 1 CTV dollar for every 6.9 BAU dollars (CTV ≈ 14.6% of BAU spend). Confidence bar: 80%.
Sales, 4 markets, +6.8% aggregate lift · iROAS 0.45x

At an 80% bar, only New York clears it (87.3%) — it's the one market where the +6.8% sales lift is worth trusting. Michigan's −4.6% carries just 3.6% confidence: that's not a decline, it's a dataset that hasn't spoken yet. At 0.45x iROAS, sales aren't yet returning more than the CTV spend cost — but CTV is only ~15% of what BAU media already spends here, so the fix is aiming that sliver of budget at New York, not pulling it.
Adrsta also ran a separate incrementality study for Tax Filing Software Company on registrations, across the same four markets:
Registrations, 4 markets, +18.6% aggregate lift

Registrations rose almost three times faster than sales, and New York is again the one market where both numbers clear the 80% bar (99.9% and 87.3%). Everywhere else, CTV is filling the funnel with a confidence the sales read hasn't earned yet.
Recovery & Wellness Company — same markets, three KPIs, one strict bar
BAU vs. CTV spend: Over the 9-week flight, Recovery & Wellness Company spent $937,500 on business-as-usual (BAU) media. CTV added $99,302 on top — roughly 1 CTV dollar for every 9.4 BAU dollars (CTV ≈ 10.6% of BAU spend). Confidence bar: 95% — the strictest of the four studies here; a market has to be almost certain before it counts.
Sales, 5 markets, +8.5% aggregate lift · iROAS 18.85x

At a 95% bar, only two of five markets clear it: California (+13.4%, 96.8%) and North Carolina (−4.3%, 99.2%) — which very nearly cancel each other out. Florida's headline-grabbing +30.6%, the number quietly propping up the entire 18.85x iROAS, sits at 89.0% confidence. Under this study's own rule, that's not confirmed. Pennsylvania's −2.0% at 0.8% confidence isn't a real result at all. The lesson isn't "don't trust 18.85x" — it's that a huge blended number can be resting on a market that wouldn't pass the study's own test.
Recovery & Wellness Company also ran incrementality studies on leads and bookings, across four of the same markets:
Leads, 4 markets, +16.8% aggregate lift

Bookings, same flight — +5.5% aggregate

Same 95% bar, and only Pennsylvania's leads clear it (+16.8%, 96.1%). California's eye-catching +20.9% sits at 86.9% — strong-looking, but not proven at this study's own line. Bookings flip the picture: California (−13.2%, 98.8%), Florida (+5.3%, 100%), and Pennsylvania (+31.7%, 100%) all clear 95%; only North Carolina doesn't. Which makes California the interesting case — its lead increase isn't confirmed, but its booking decrease is. The one thing we can say with confidence about California is that fewer of those extra leads turned into bookings, not that CTV drove more leads in the first place. Skim the headline numbers and you'd read it backwards.
Kids' Mental Wellness Company — where power analysis is the whole story
BAU vs. CTV spend: Over the 7-week flight, Kids' Mental Wellness Company spent $838,542 on business-as-usual (BAU) media. CTV added just $25,000 on top — roughly 1 CTV dollar for every 33.5 BAU dollars (CTV ≈ 3.0% of BAU spend). Confidence bar: 70% — the lowest of the four, which makes what happens next more telling, not less.
Sales, 5 markets, +10.2% aggregate lift · iROAS 0.41x

+10.2% looks like a clean win — until you check it against the study's own 70% bar. Only Massachusetts clears it, and only just (+10.2%, 70.9%). Florida (−15.0%, 22.6%), Michigan (−0.7%, 40.3%), Oregon (+8.6%, 56.0%), and Virginia (+1.9%, 31.6%) all land below the line — noise, not results. So the honest read isn't "inconclusive everywhere" — it's one confirmed market carrying an aggregate number that's mostly still unproven. Even with a bar this forgiving, four of five markets didn't clear it. That's still not a number to bet a budget on, and the 0.41x iROAS — a blend across all five markets — shouldn't be trusted as a final verdict either.
This is what Adrsta's power analysis is for. Before a flight launches, it checks if the test is even big enough to catch a real lift. Run here, it would have flagged the problem early: too many markets, not enough time. The fix is simple — fewer, bigger markets, or a longer flight. That's the real value Adrsta adds: not just "did it work," but "will this test even give you a real answer."
Pet Supplements Company — running it twice and getting the same answer
BAU vs. CTV spend: Over the 4-week flight, Pet Supplements Company spent $250,000 on business-as-usual (BAU) media. CTV added $20,000 on top — roughly 1 CTV dollar for every 12.5 BAU dollars (CTV ≈ 8.0% of BAU spend). Confidence bar: 69% — and every market in both studies below clears it.
Full product catalog, 3 markets, +20.3% aggregate lift · iROAS 1.33x

Single product line, same 3 markets, +19.3% aggregate lift · iROAS 1.26x

Two separate studies, same three markets, one testing the full product catalog and one narrowed to a single product line — and at this study's 69% bar, all three markets clear it in both reads. California and Michigan clear it comfortably (94–100% confidence both times); Texas clears it right at the line (69.7% and 69.3%). That's the strongest kind of evidence you can get: not just aggregate lifts landing within a point of each other (+20.3% and +19.3%), but every individual market confirmed twice over.
The Takeaway: What Actually Matters
One big number is a good headline. It's a bad reason to make a budget decision on its own. Here's what actually matters:
- Look at every market, not just the total. One strong market can carry — or hide — the whole result.
- Know the bar before you trust the number. These four studies used four different confidence levels (69%–95%). Clearing a low bar isn't the same as clearing a high one.
- Match the metric to what matters. Leads, sales, and bookings can move in different directions — even in the same market, at the same time.
- A small budget can still prove a real effect. CTV was just 3–15% of what these advertisers were already spending, and it still moved the needle — but only because it was actually measured, not assumed.
- Test before you spend, not just after. A quick check upfront can tell you if your test is even big enough to give you a real answer.
- When you can, run it twice. Two studies agreeing is stronger proof than one.