Primary Challenge: Measurement of Causal Impact
CTV advertising lacks direct attribution mechanisms such as click-through tracking or persistent cookie-based identifiers. Consequently, traditional deterministic tracking cannot reliably link ad exposure to conversion events across extended time horizons.
Advertisers frequently rely on platform-reported metrics, which may contain self-attribution bias, or aggregate lift figures that do not distinguish between incremental conversions and baseline organic performance.
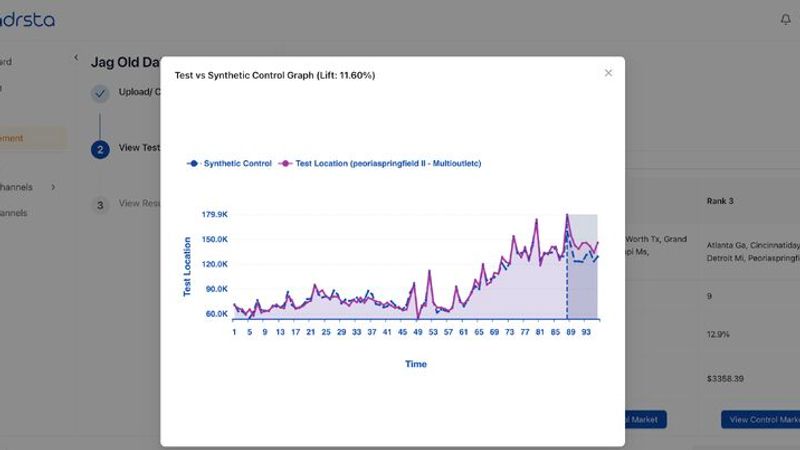
The objective of the analysis is to determine the true causal effect of the campaign—specifically, whether the observed conversions were induced by the media spend or would have occurred in the counterfactual scenario. The counterfactual scenario is mimicked using GeoLift.
Adrsta Advantage
Traditional experimental designs by different measurement vendors often require substantial spend increases to achieve statistical power. Adrsta methodology offers the following advantages:
- Adrsta utilizes precise market setting to detect causal effects at lower spend-to-BAU ratios where BAU is business-as-usual spend. We do this by identifying optimal test markets (a small subset of all available markets).
- We provide a robust measurement solution at a fraction of standard testing costs.
- We provide the following reports to the clients:
- Test Design: This recommends the test markets, campaign duration, campaign spend at a market level and expected lift as a part of pre-flight power analysis.
- Measurement: This measures the lift percentage and Incremental Return on Ad Spend (iROAS) at an aggregate level with their confidence intervals. We further provide lift percentage with a confidence interval and statistical significance at individual market level. We provide this measurement as a mid-flight read and final read currently but the frequency is flexible.
- The measurement is available at different levels of the funnel.
Analysis: Statistical Evaluation of Four Verticals
The following analysis evaluates eight studies across four advertisers, examining BAU spend, CTV investment, confidence thresholds, and incremental lift.
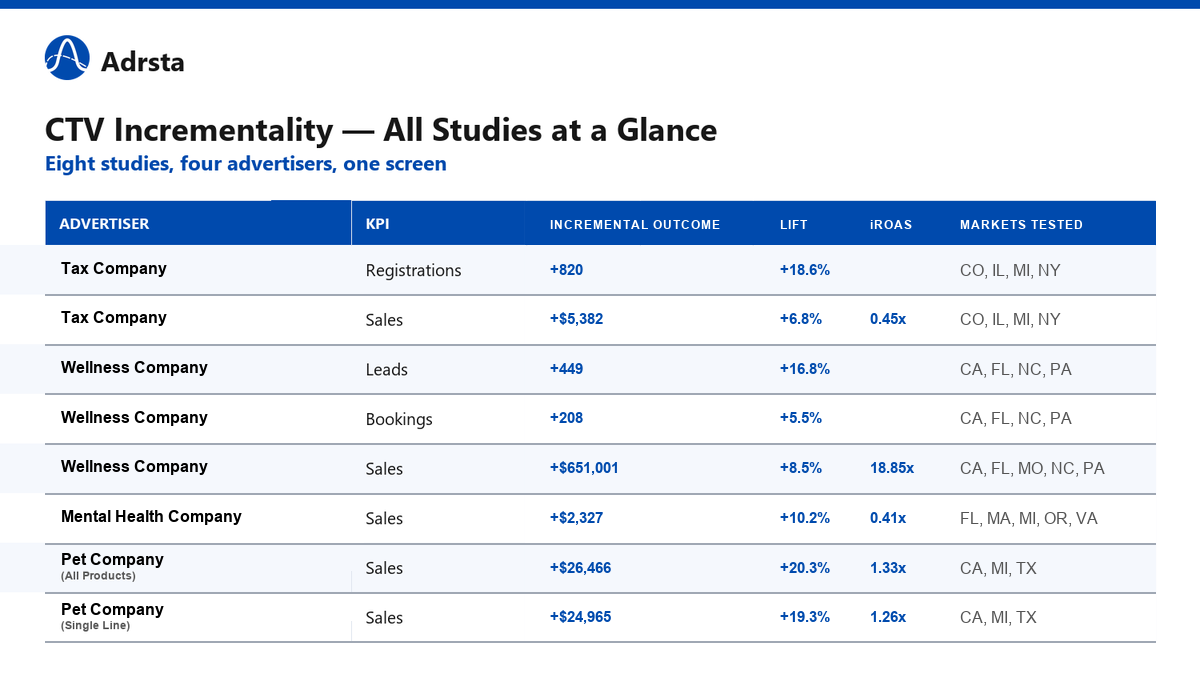
While aggregate figures may indicate positive performance, the validity of these results is dependent on the statistical confidence of the individual market data.
Tax Services Vertical — Sales and Registrations studies
BAU vs. CTV spend: The details of advertisement spend for the Tax Company are as follows:
| BAU spend ($335,417) | CTV spend ($48,827) | CTV spend/BAU (14.6%) | Campaign duration (21 days) | Confidence threshold: (80%) |
|---|
Sales, 4 markets, +6.8% aggregate lift · iROAS 0.45x · +$5,382 incremental sales
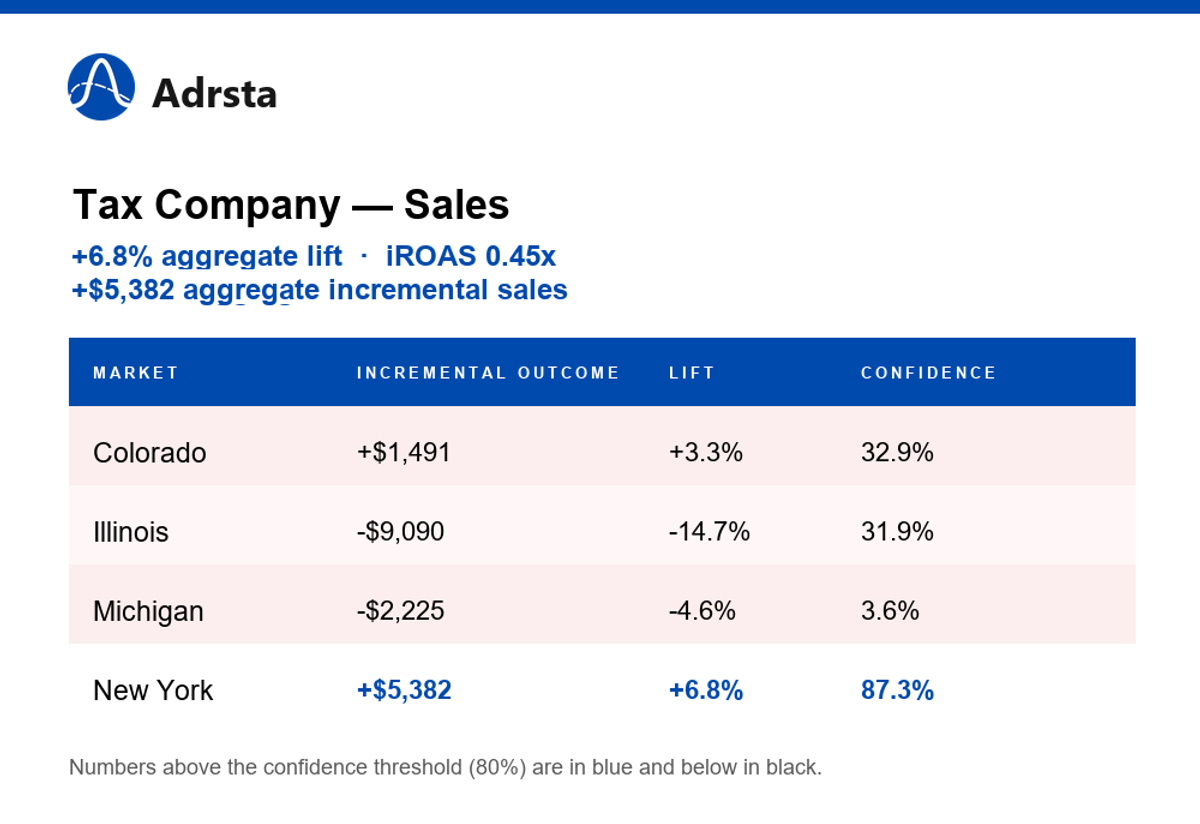
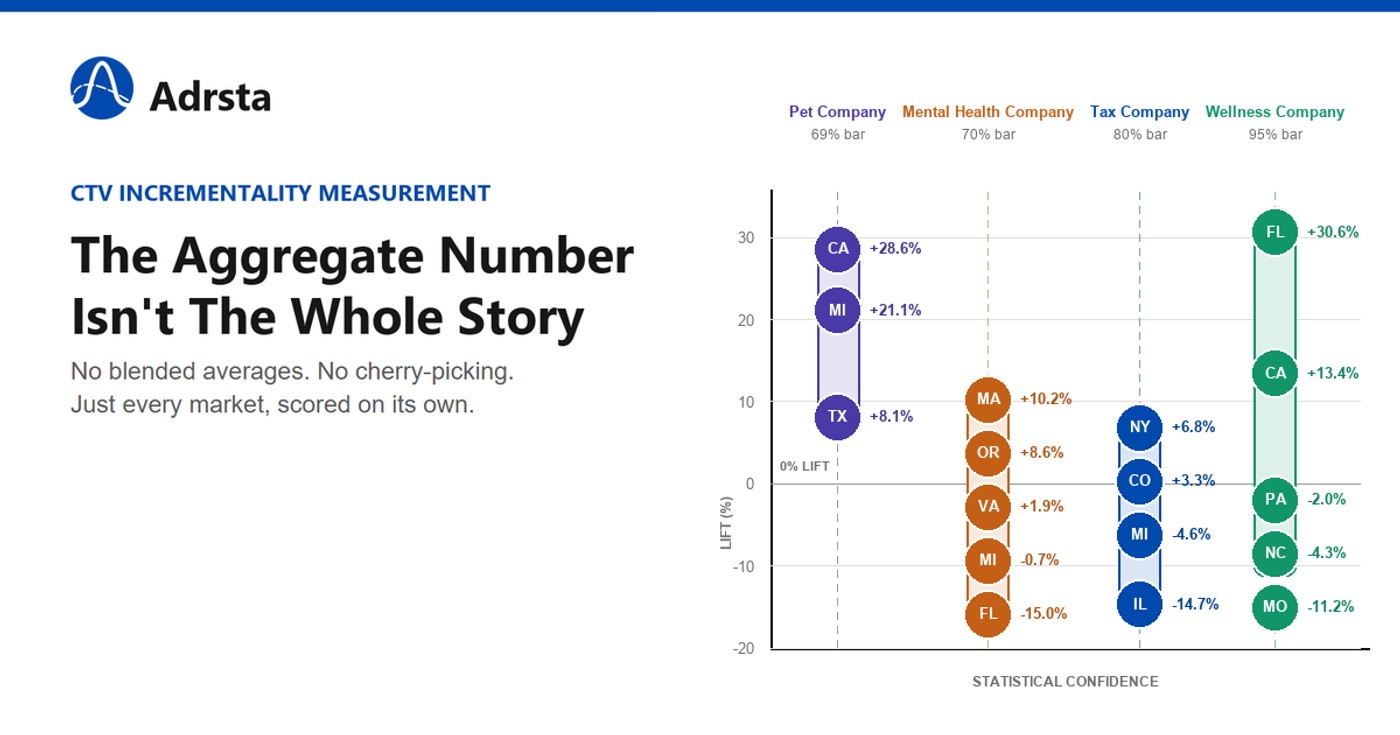
With the confidence threshold established at 80%, New York is the only market to demonstrate a statistically significant result (87.3% confidence). Further, the market of Michigan has low statistical significance. Thus, except for New York the statistical significance in the markets of Colorado, Illinois and Michigan is low.
Thus, the incremental sales is low which leads to a low iROAS of 0.45x. This can be root-caused to following reasons:
- The Tax Company has only a season where most Sales happen for it.
- The campaign happened in the off-season which was flat historically in the previous year.
Thus, providing a sales increment at one market with statistical significance is an achievement.
Adrsta also ran a separate incrementality study for Tax Filing Software Company on registrations, across the same four markets:
Registrations, 4 markets, +18.6% aggregate lift · +820 incremental registrations
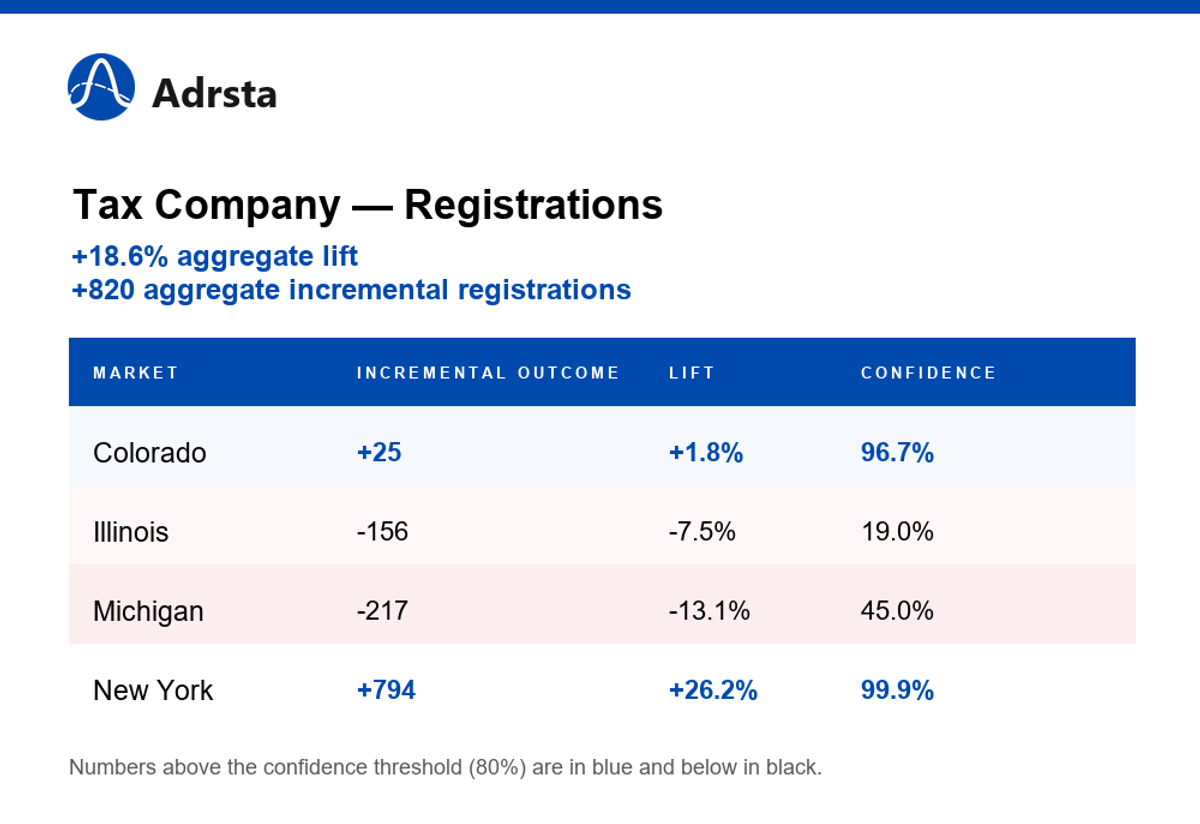
The true impact of the CTV campaign can be seen in the Tax company registrations based GeoLift. Note, that in this case two test markets of New York and Colorado have high statistical significance of 99.9% and 96.7% compared to Tax company sales.
The registrations results indicate an overall success with high increment lift (18.6%) with high statistical significance of 96.7%. Thus, CTV has impacted top-of-funnel metrics with a high level of confidence.
Further, when evaluating studies which happen at different levels of funnel, one needs to look at aggregate results instead of the individual test markets where the percentages would not be the same unless their KPI data is correlated at a time-series level.
Wellness Vertical — Comparative KPI Analysis with High Confidence Parameters
BAU vs. CTV spend: The details of advertisement spend for the Wellness Company are as follows:
| BAU spend ($937,500) | CTV spend ($99,302) | CTV spend/BAU (10.6%) | Campaign duration (9 weeks) | Confidence threshold: (95%) |
|---|
Sales, 5 markets, +8.5% aggregate lift · iROAS 18.85x · +$651,001 incremental sales
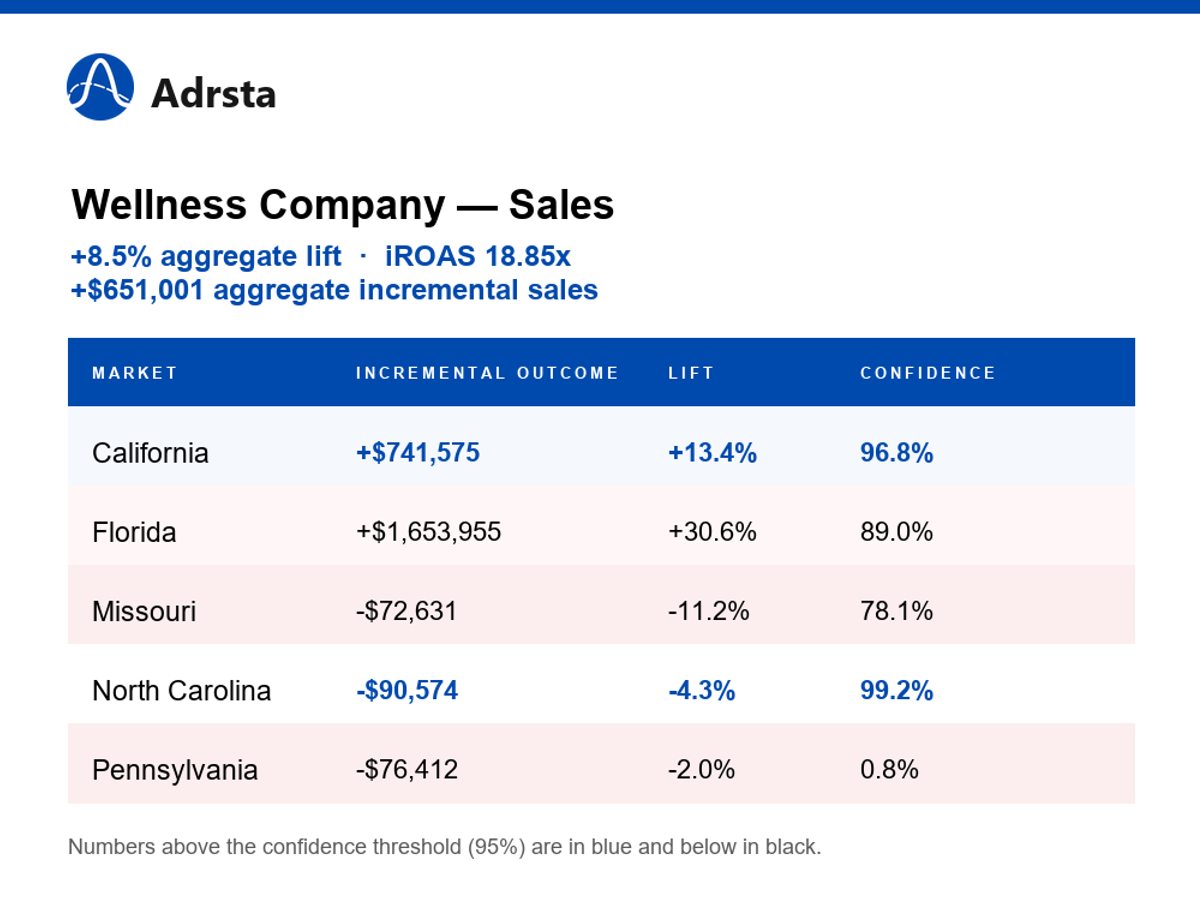
With a confidence threshold of 95%, two test markets of California (96.8%) and North Carolina (96.8%) achieve statistical significance and the aggregate lift increment is positive. Further, the test markets Florida (89%) and Missouri (78.1%) have an average confidence threshold and only Pennsylvania (0.8%) have a low confidence level. This indicates an overall success of the CTV campaign.
However, the iROAS of 18.85x seems to be really high and it can be attributed to two reasons:
- The success of the campaign which makes incremental sales at an aggregate level and a low level of ad spend compared to it.
- The ad spend to sales ratio is , which makes it unusually low at
Wellness Company also ran incrementality studies on leads and bookings, across four of the same markets:
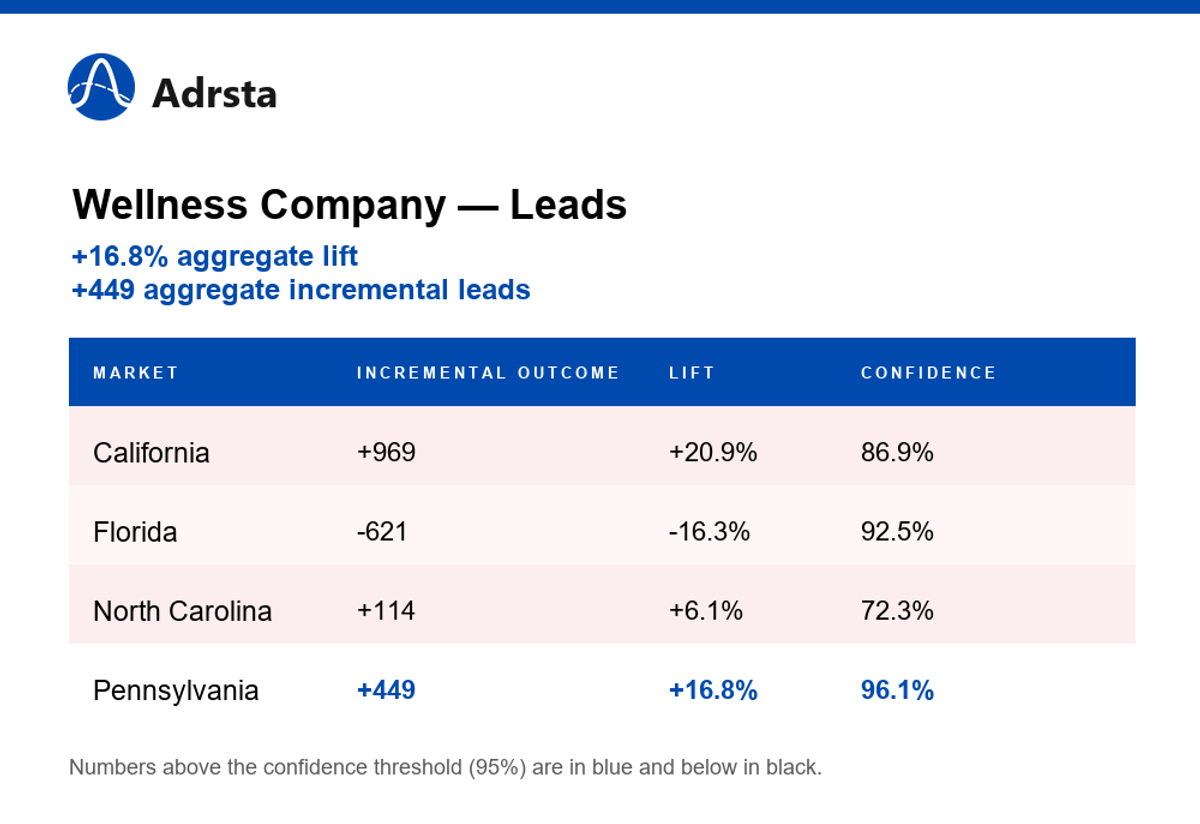
Leads, 4 markets, +16.8% aggregate lift · +449 incremental leads
Bookings, same flight — +5.5% aggregate · +208 incremental bookings
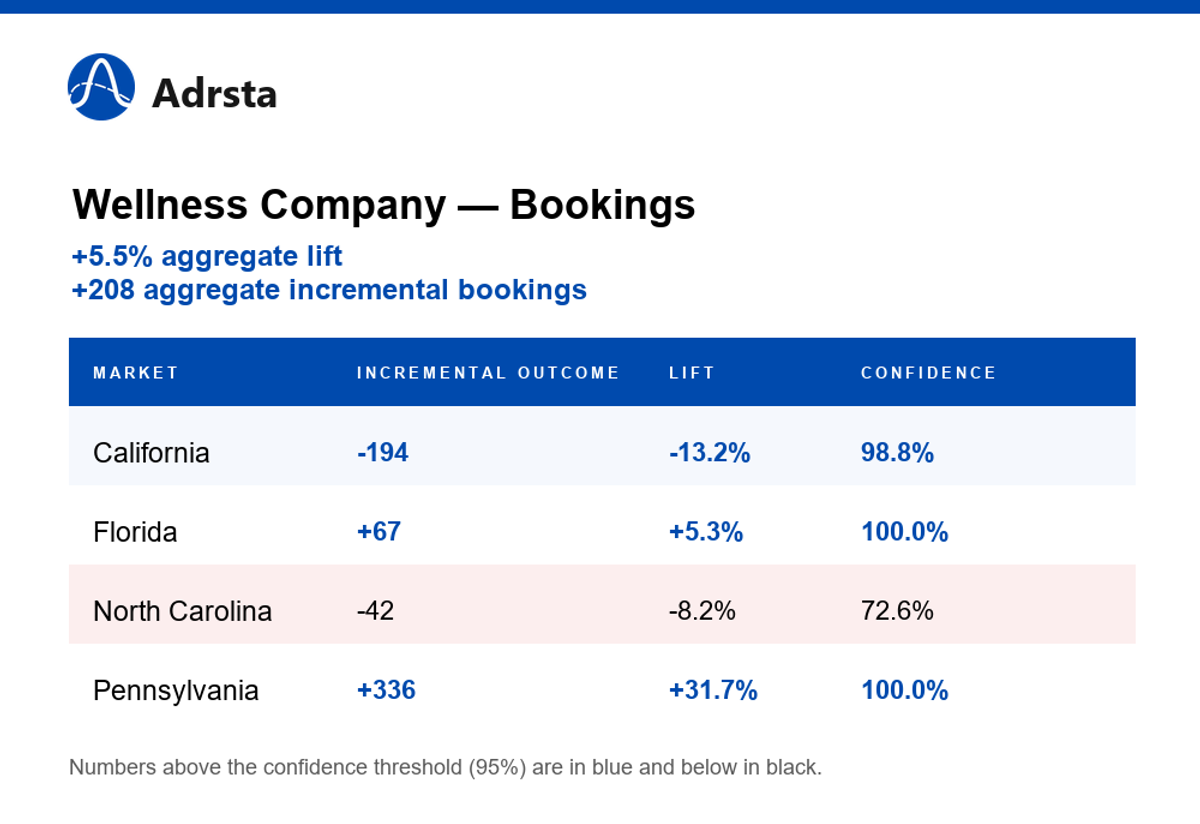
The following can be seen from the Wellness Company Leads and Bookings results:
- Leads Results: Aggregate lift 16.8% and Pennsylvania (96.1%) is contributing to it. Florida (92.5%) and California (86.9%) have high confidence levels.
- Bookings Results: Aggregate lift 5.5% and Pennsylvania (100%), Florida (100%) are positively contributing to it and California (98.8%) is negatively contributing to it.
The difference in markets clearing the statistical confidence threshold, highlights the following interpretations:
- The importance of analyzing aggregate results across correlated variables to interpret campaign efficacy instead of individual test markets whose KPIs might not be highly correlated at a time-series level.
- The bookings KPI need not be completely accurate as there would be some loss due to source attribution.
Mental Health Vertical — Power Analysis and Budgetary Constraints
BAU vs. CTV spend: The details of advertisement spend for the Mental Health Company are as follows:
| BAU spend ($838,542) | CTV spend ($25,000) | CTV spend/BAU (3%) | Campaign duration (7 weeks) | Confidence threshold: (70%) |
|---|
Sales, 5 markets, +10.2% aggregate lift · iROAS 0.41x · +$2,327 incremental sales
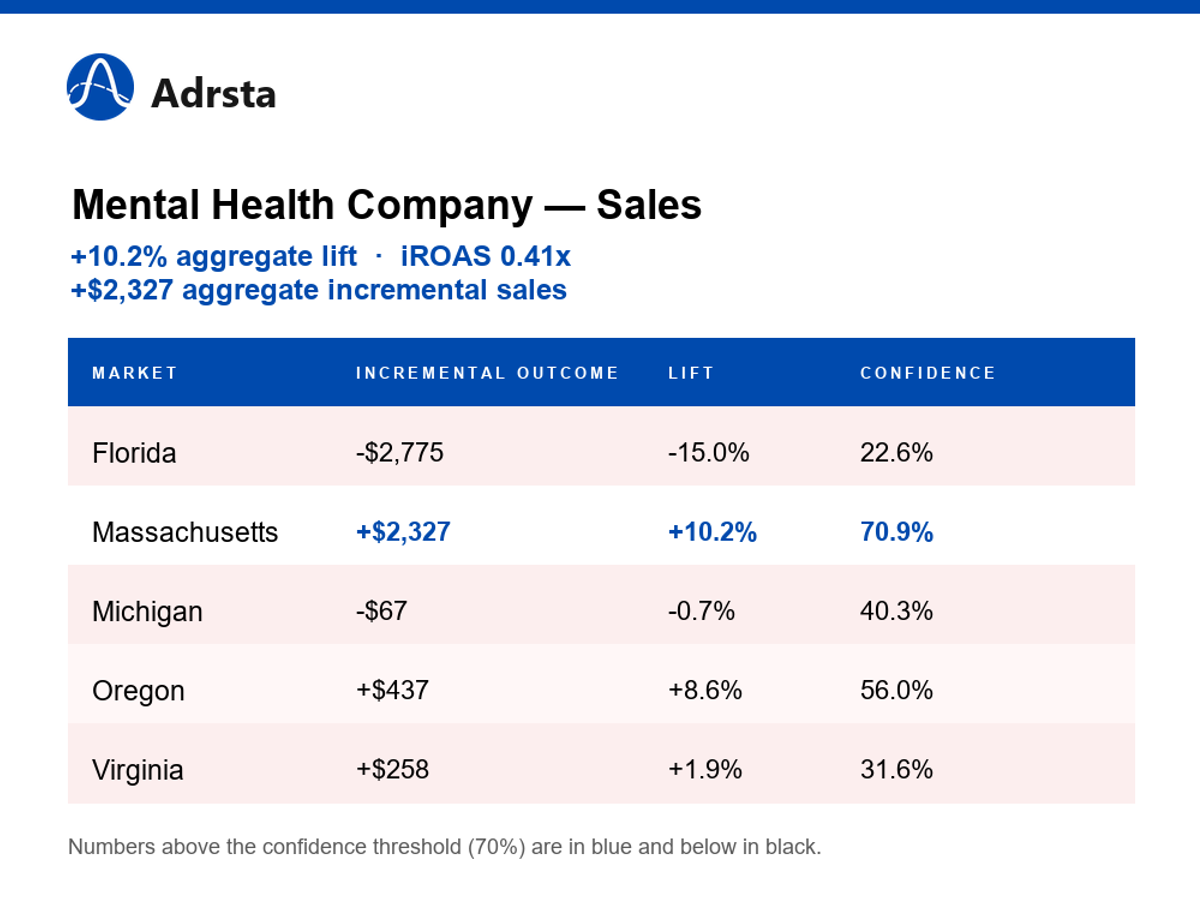
With a confidence threshold of 70%, only Massachusetts (70.9%) cleared this whereas other test markets have low confidence levels including Florida (22.6%), Michigan (40.3%), Oregon (56.0%) and Virginia (31.6%) resulting in an aggregate lift of 10.2%. Thus, overall the campaign has only a single market clearing the threshold and this can be attributed to the following:
- The baseline for this business was in a year-on-year decline.
- The business has different seasonal peaks and not the holiday season which was an off-peak period for the business.
Pet Care Vertical — Experimental Replication and Consistency
BAU vs. CTV spend: The details of advertisement spend for the Pet Company are as follows:
| BAU spend ($250,000) | CTV spend ($20,000) | CTV spend/BAU (8%) | Campaign duration (5 weeks) | Confidence threshold: (69%) |
|---|
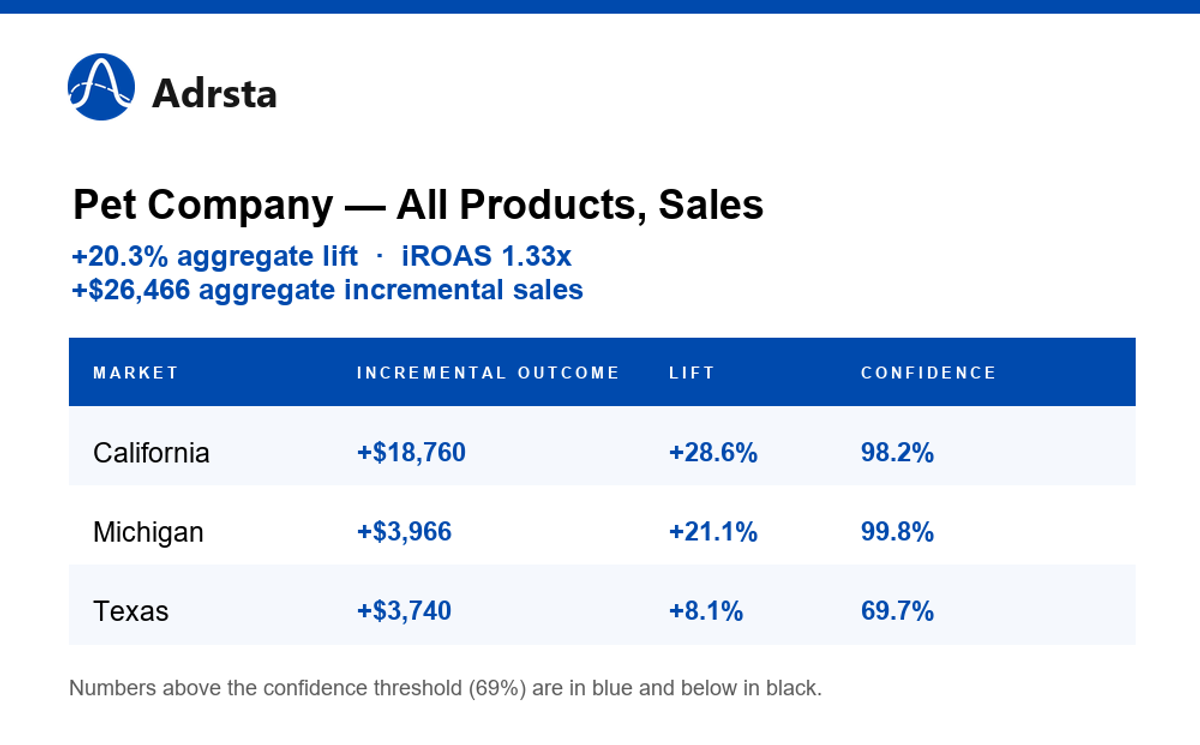
Full product catalog, 3 markets, +20.3% aggregate lift · iROAS 1.33x · +$26,466 incremental sales
Single product line, same 3 markets, +19.3% aggregate lift · iROAS 1.26x · +$24,965 incremental sales
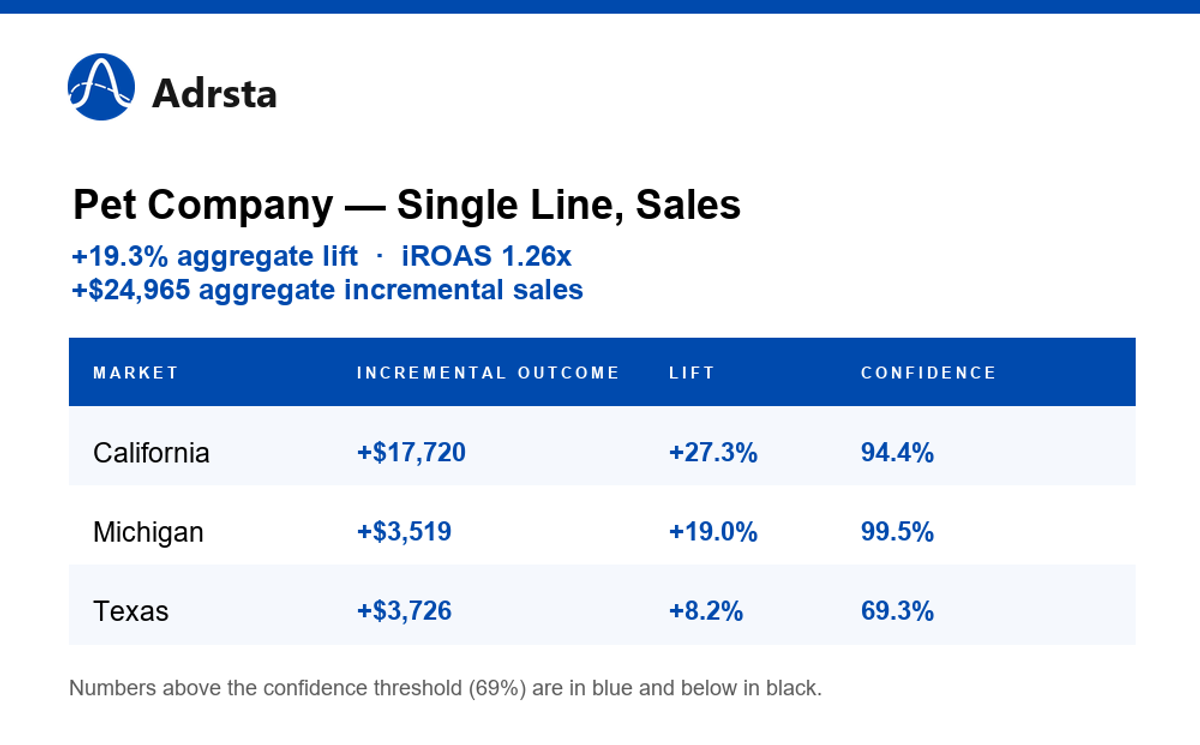
With a confidence threshold of 69% and two separate studies point to an high aggregate lift percentage of 20.3% and 19.3% for all products and single product line respectively. This indicates a success of the campaign and can be attributed to the following:
- The business for the pet company is growing on a year-on-year basis.
- All the individual markets clear the confidence threshold of 69%. The markets of Michigan and California have above 95% confidence level for both the products. This means that test markets have performed well over and above the control markets even in this growing business.
Methodological Summary and Learnings
Effective causal measurement of CTV incrementality requires adherence to the following technical principles:
- Granular Market Analysis: Aggregate lift can be skewed by outliers; statistical significance must be verified at the individual market level though we have removed extreme outliers.
- Confidence Threshold Rigor: Results are only as reliable as the established confidence intervals. Interpreting low-confidence data as "noise" is essential for accurate budgeting but this depends on client to client results.
- Multi-KPI Correlation: Leads, bookings, and sales may exhibit divergent directionality based on the conversion funnel and tracking limitations at a test market level. Thus, one needs to look at an aggregate level.
- Spend Ratio Optimization: Synthetic control methods enable the detection of causal effects at low spend-to-BAU ratios (3-15%) when treated markets are precisely selected. This has especially worked for growing businesses and salvaged declining ones.
- Baseline Influence: Causal lift is relative to the counterfactual; the underlying business growth or decline significantly impacts the magnitude of the observable delta.
- Predictive Power Analysis: Pre-flight testing determines if the experimental design is sufficiently powered to yield statistically significant results.
- Replication for Validity: Ideally, staggered or repeated studies serve as a mechanism for internal validation, increasing the reliability of the causal inference.